$ ls /blog

Blog

Sumologic
Sumologic

How to Visualize OpenTelemetry Logs from Sumo Logic API in Grafana

Modern observability platforms provide powerful capabilities for collecting, searching, and analyzing application logs. However, engineering teams may want to visualize this data in Grafana, especially when Grafana is already their preferred platform for operational dashboards. If your applications use OpenTelemetry to collect logs and Sumo Logic as the backend, you can use the Sumo Logic […]

read article →
grafana-dashboard-from-sumologic-api Sumologic
Sumologic

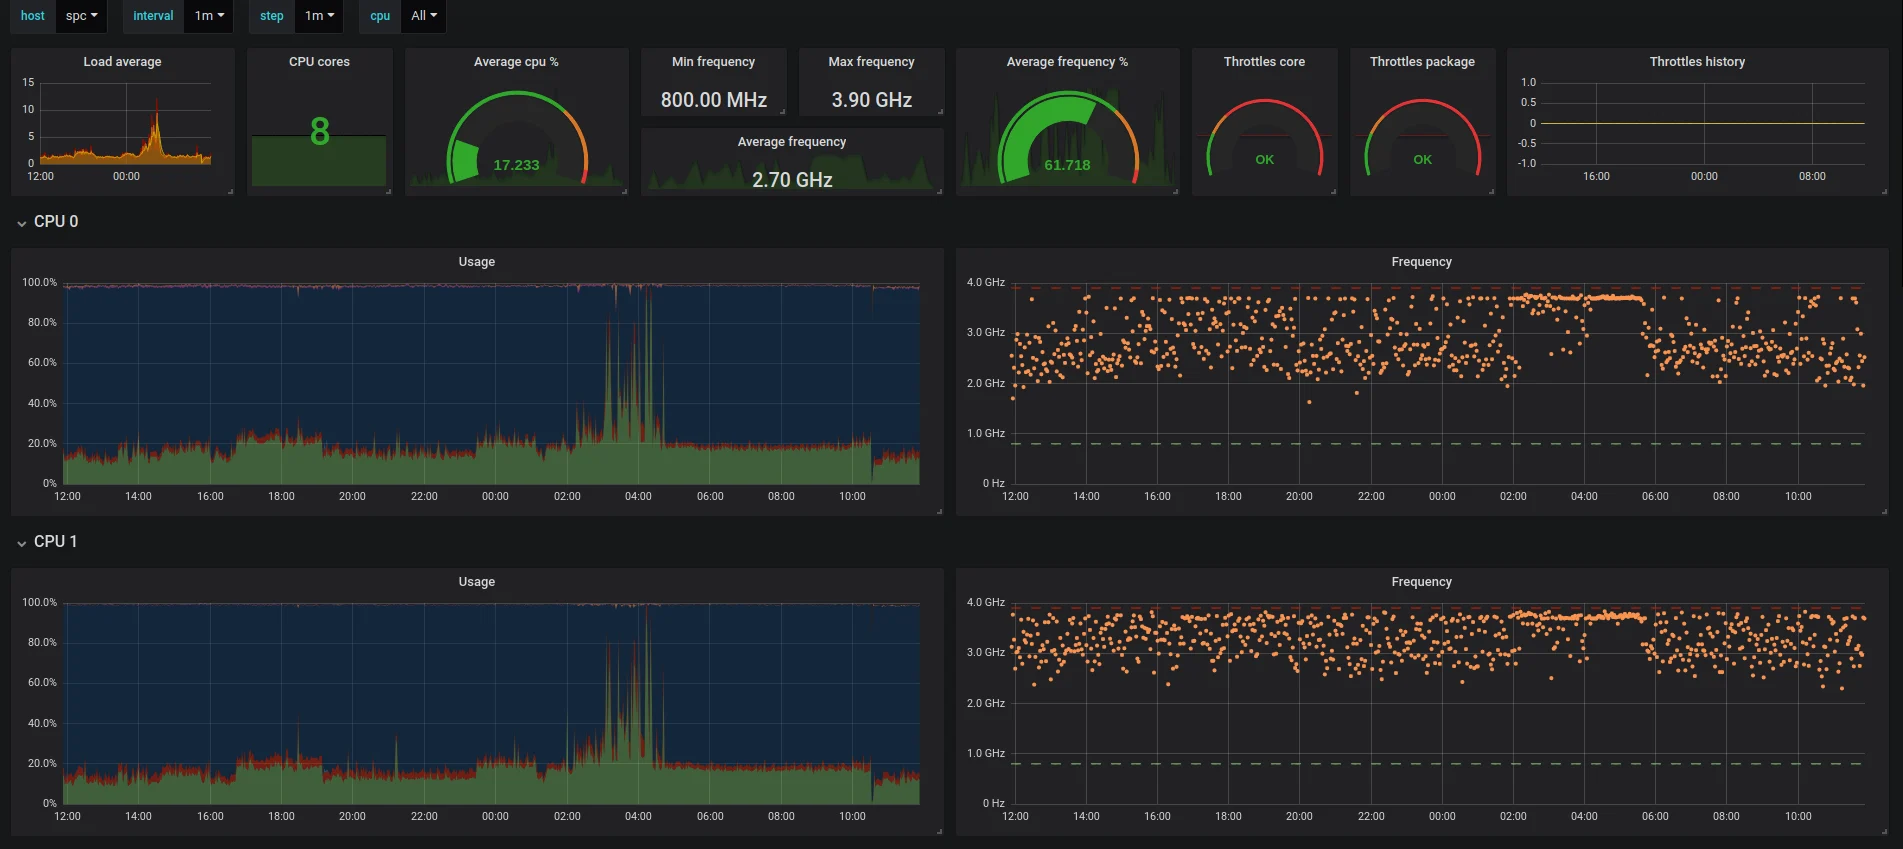
How to Visualize OpenTelemetry Metrics from Sumo Logic API in Grafana

Modern observability environments rarely consist of a single tool. An application may generate telemetry through OpenTelemetry, store and analyze that telemetry in an observability platform, and use a separate visualization tool for operational dashboards. In this article, we’ll look at exactly that setup: OpenTelemetry metrics from a Java Tomcat environment are sent to Sumo Logic […]

read article →
How to reduce Open Telemetry in production Open Telemetry
Open Telemetry

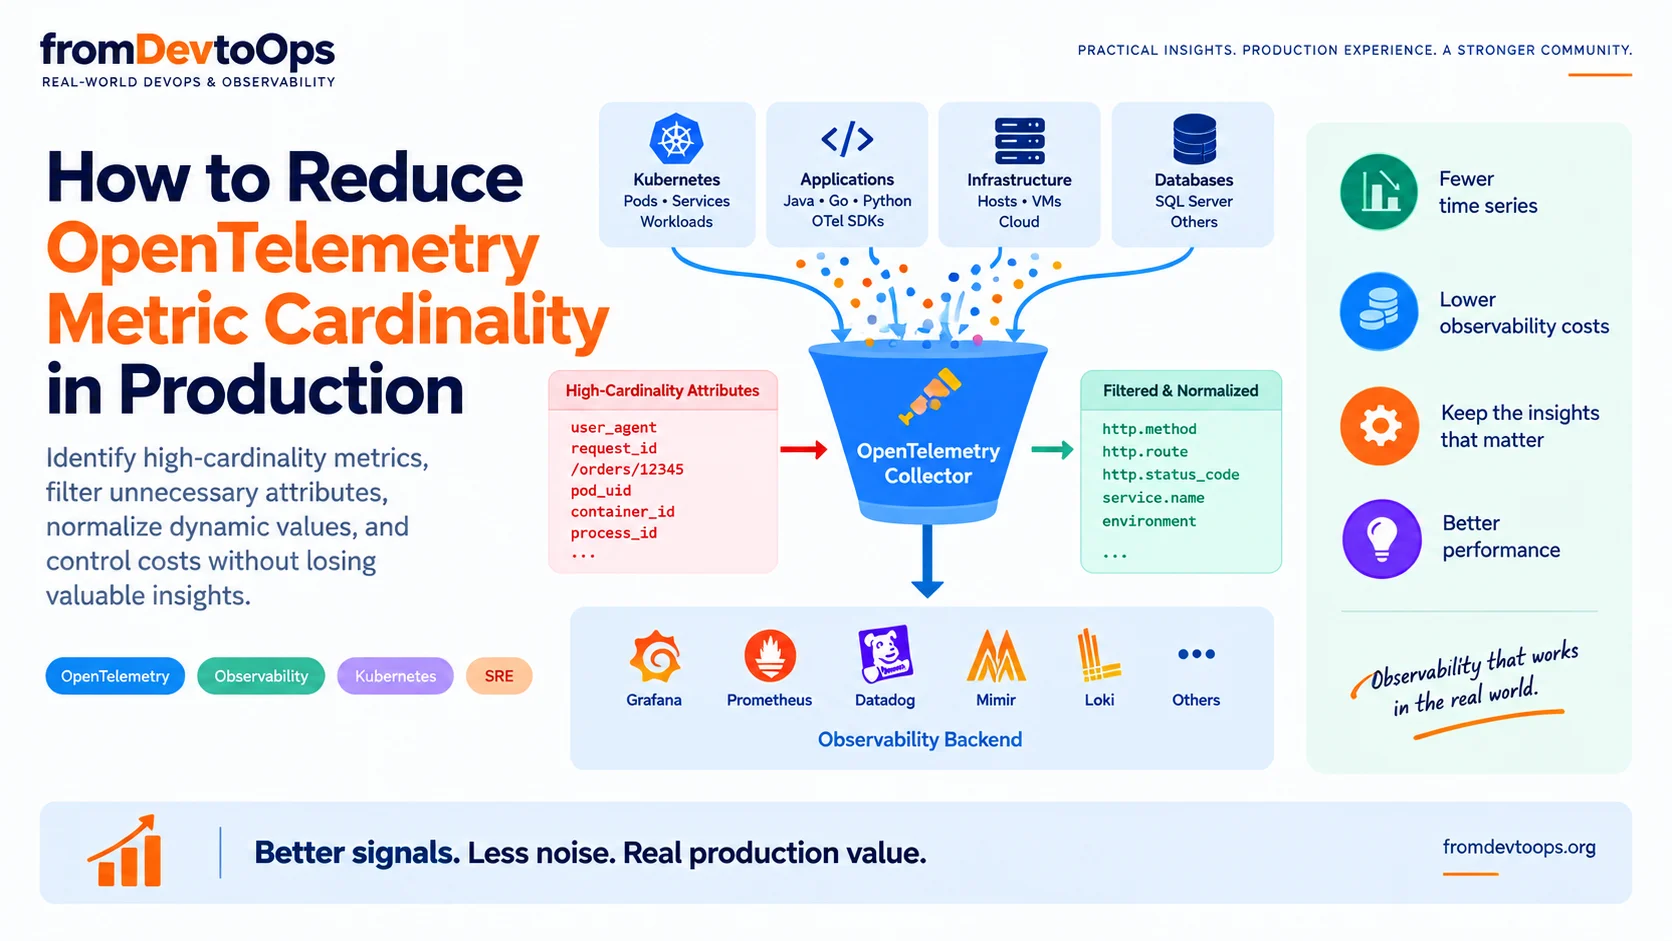
How to Reduce OpenTelemetry Metric Cardinality in Production

High OpenTelemetry metric cardinality can create millions of time series, increase observability costs, and make your metrics backend harder to operate. Here’s how we identified and reduced metric cardinality in a Kubernetes environment without throwing away useful telemetry. OpenTelemetry makes it remarkably easy to instrument modern applications. You add instrumentation, collect metrics, send them to […]

read article →
$ sudo join-community

Your terminal has 47 tabs open. Come talk to people who understand.

Free to join. No sales calls, no swag quotas - just people who ship for a living.