
How to Reduce OpenTelemetry Metric Cardinality in Production
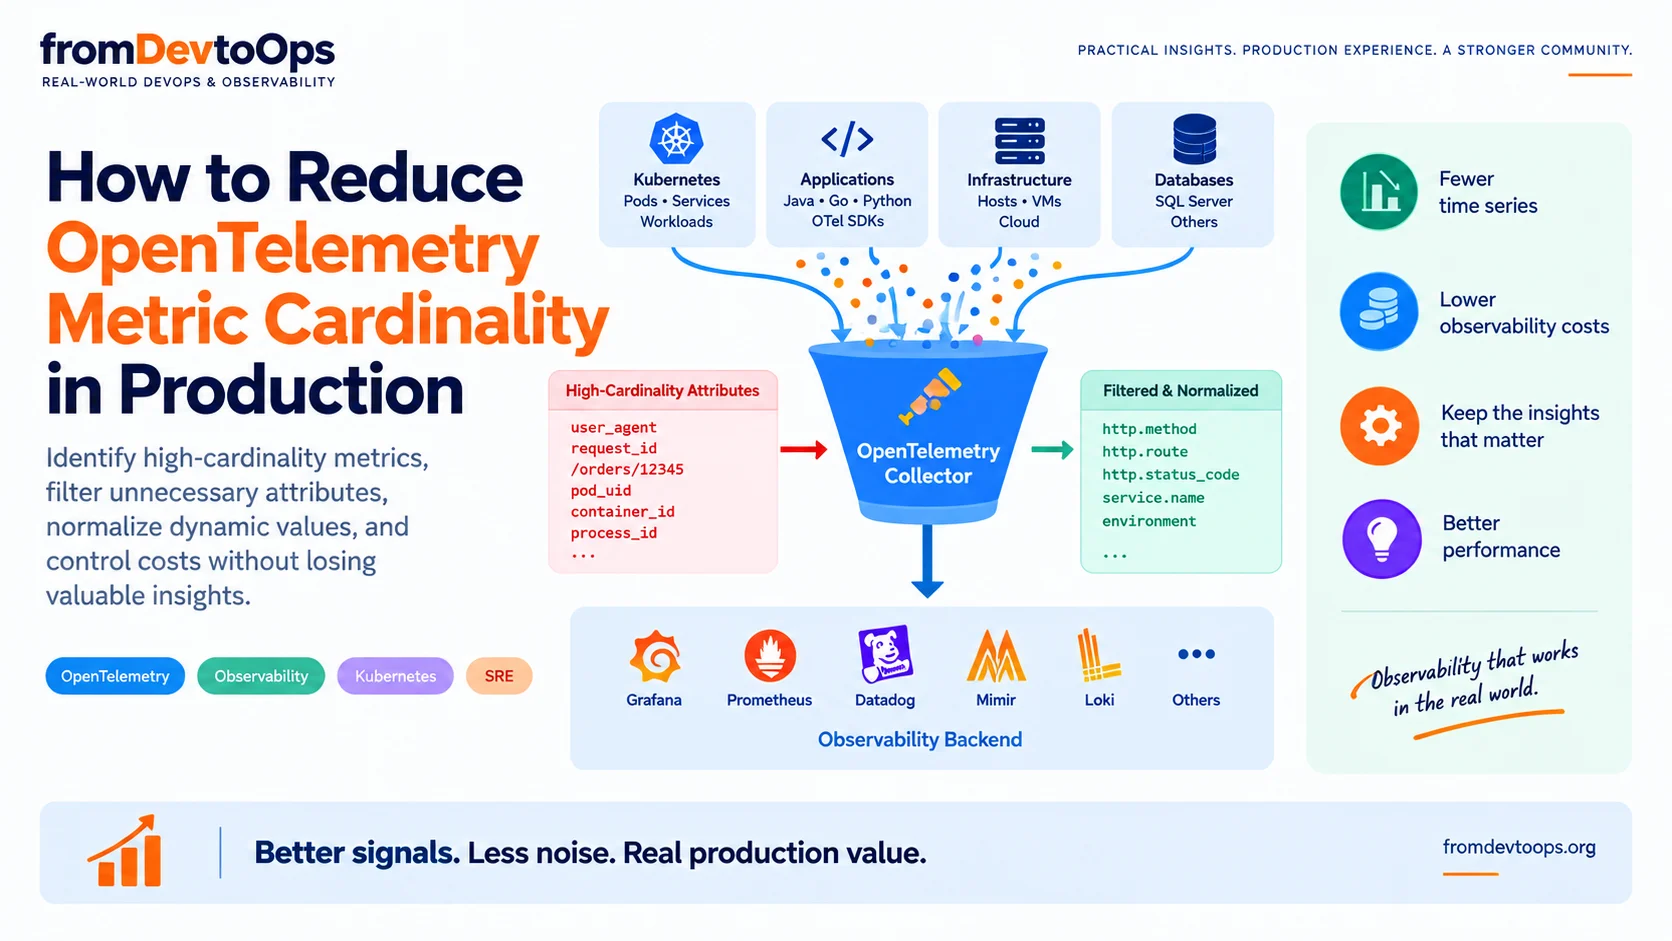
High OpenTelemetry metric cardinality can create millions of time series, increase observability costs, and make your metrics backend harder to operate. Here’s how we identified and reduced metric cardinality in a Kubernetes environment without throwing away useful telemetry.
OpenTelemetry makes it remarkably easy to instrument modern applications.
You add instrumentation, collect metrics, send them to your observability backend, and suddenly you have visibility into HTTP requests, Kubernetes workloads, processes, and infrastructure.
But there is a catch.
The more dimensions you attach to your metrics, the more unique time series you create.
And in a Kubernetes environment, metric cardinality can grow surprisingly quickly.
We recently investigated an OpenTelemetry metrics pipeline that was producing roughly 100 million datapoints per day. At first, the problem looked like a simple telemetry-volume problem.
It wasn’t.
The bigger issue was metric cardinality.
Three HTTP metrics were generating a disproportionately large number of time series because of the attributes attached to them. Instead of simply removing those metrics, we changed the way their dimensions were managed.
The result was a substantial reduction in active metric series and overall telemetry volume while retaining the dimensions we actually needed for troubleshooting.
This article explains the investigation, the remediation strategy, and the OpenTelemetry Collector configuration we used.
What Is OpenTelemetry Metric Cardinality?
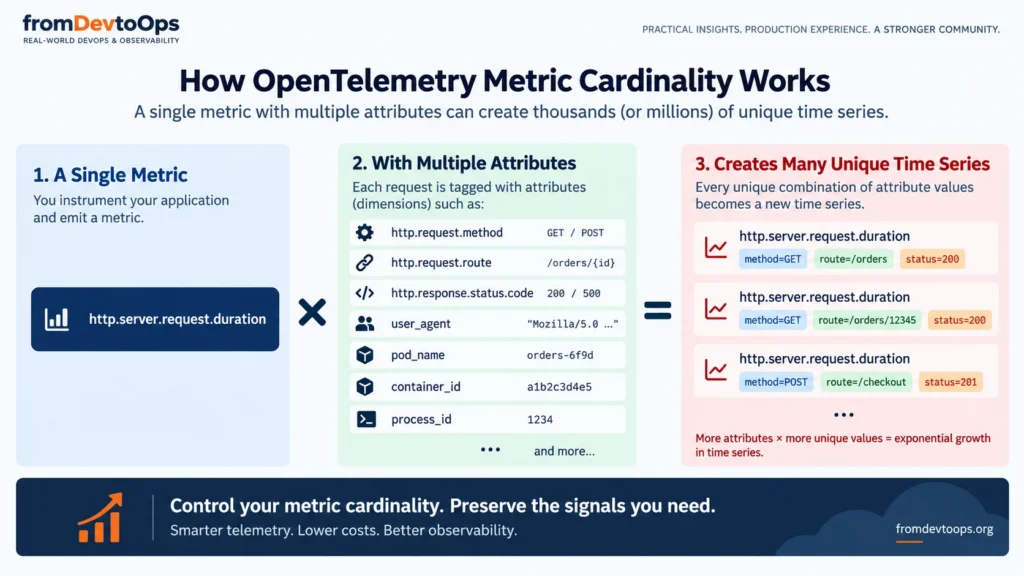
Before looking at the solution, it is important to understand what metric cardinality actually means.
A metric name by itself doesn’t tell you how many time series that metric creates.
Consider:
http.server.request.duration
That looks like a single metric.
Now imagine that every datapoint also contains:
http.request.method
http.request.route
http.response.status.code
user_agent
pod_name
pod_uid
container_id
process_id
Each unique combination of those attribute values can result in a different time series.
Conceptually:
Metric
  ×
Attribute combinations
  =
Unique time series
For example:
http.server.request.duration
method=GET
route=/orders
status=200
is one series.
But:
http.server.request.duration
method=GET
route=/orders/12345
status=200
can be another.
And:
http.server.request.duration
method=GET
route=/orders/67891
status=200
can become yet another.
The metric name hasn’t changed.
The number of unique series has.
That’s the fundamental difference between metric volume and metric cardinality.
Metric Volume vs Metric Cardinality
These two concepts are often confused.
Metric volume
Metric volume is about how many datapoints you are sending.
For example:
100 million datapoints/day
That tells you how much telemetry is being ingested.
Metric cardinality
Cardinality is about how many unique time series exist.
For example:
10,000 unique time series
or:
1 million unique time series
You can have a relatively small number of metric names and still create an enormous number of time series.
This happens when metrics have attributes with many unique values.
That’s why simply asking:
“How many metrics are we collecting?”
is not enough.
A better question is:
“How many unique time series are those metrics producing, and which dimensions are responsible?”
Why Kubernetes Makes Metric Cardinality Worse
Kubernetes environments are particularly susceptible to cardinality growth.
Applications and workloads are dynamic.
Pods are created and destroyed.
Containers restart.
Processes receive new identities.
Deployments roll out new versions.
Request URLs contain dynamic values.
Each of these can introduce additional attribute values.
For example, consider:
k8s.pod.name
k8s.pod.uid
container.id
process.pid
http.request.route
user_agent
Some of these attributes may have extremely high churn.
A pod restart can create a new pod identity.
A container restart can create a new container ID.
A process restart can create a new PID.
And an application receiving dynamic URLs can generate a large number of unique route values.
The result is multiplicative.
A metric that looked harmless in development can become expensive at production scale.
Our OpenTelemetry Cardinality Problem
Our first signal was metric ingestion.
The environment was producing approximately:
100 million datapoints per day.
The obvious question was:
Are we collecting too many metrics?
We didn’t want to immediately reduce the number of metrics.
Instead, we investigated the dimensions.
We wanted answers to three questions:
- Which metrics were generating the most active series?
- Which attributes were contributing the most unique values?
- Was the problem concentrated in a particular workload or collector?
This changed the direction of the investigation.
Instead of asking:
“Which metrics can we delete?”
we asked:
“Which dimensions are creating unnecessary series?”
Finding the High-Cardinality OpenTelemetry Metrics
Three HTTP metrics immediately stood out:
http.server.request.duration
http.server.request.count
http.server.request.sum
These metrics had significantly more series than the ordinary host-level metrics we were collecting.
That gave us a much narrower investigation area.
The next question was:
Why were these HTTP metrics producing so many unique series?
The answer was in their attributes.
Some of the dimensions contained values such as:
user_agent
request route
pod identity
process ID
container identity
These values can have very high cardinality.
Dynamic HTTP Routes Are a Major Source of Cardinality
Consider these two URLs:
/search/customer/12345/orders
/search/customer/67891/orders
From an application perspective, both requests may represent the same endpoint:
/search/customer/{customer_id}/orders
But if the complete URL is stored as a metric dimension, the telemetry backend can see them as two different values.
Now imagine:
- thousands of customers
- thousands of requests
- multiple pods
- multiple containers
- multiple processes
The number of combinations can grow extremely quickly.
This is one of the most important patterns to look for when troubleshooting high-cardinality HTTP metrics.
Don’t Just Delete the Route
One tempting solution would be:
Remove
http.request.route.
That would reduce cardinality.
But it would also remove useful information.
During an incident, engineers often need to answer:
Which endpoint is experiencing problems?
Removing the route entirely makes that question harder to answer.
Instead, we normalized the route.
For example:
/search/name/1212/name
could become:
search
And:
/orders/9987/items
could become:
orders
While:
/checkout
becomes:
checkout
The goal isn’t to preserve every character of the URL.
The goal is to preserve enough information to identify the logical endpoint without creating a unique metric series for every dynamically generated URL.
Controlling Cardinality with the OpenTelemetry Collector
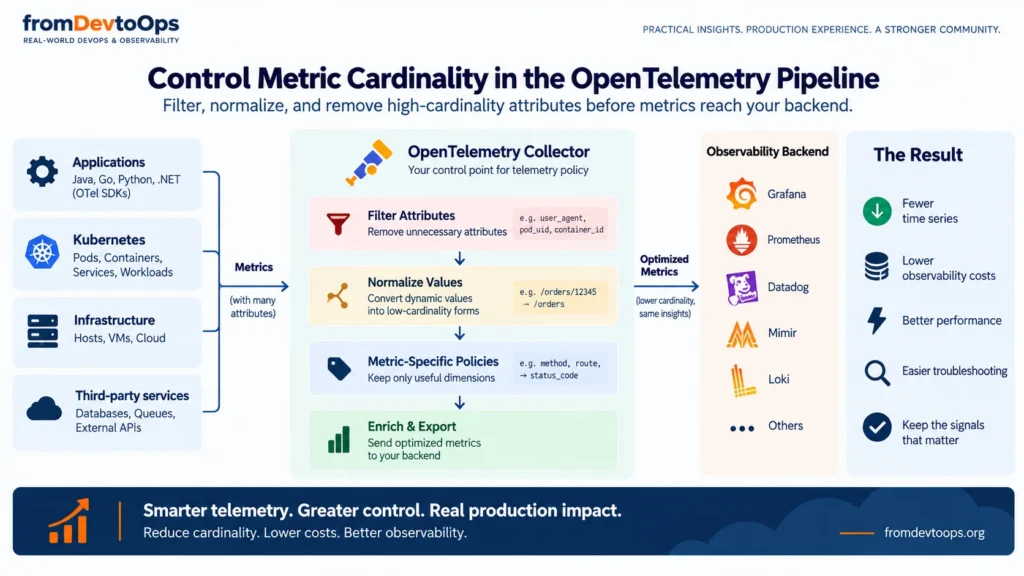
We implemented the cardinality controls in the OpenTelemetry Collector.
This gave us a central place to enforce telemetry policies rather than modifying every application individually.
The first step was to define which attributes were actually useful for the HTTP request metric.
We retained:
http.request.method
http.response.status.code
http.request.route
We removed unnecessary request attributes such as:
user_agent
We then normalized the route.
A simplified version of the transformation looked like this:
transform/http_server_request_duration:
  error_mode: ignore

  metric_statements:
    - context: datapoint

      conditions:
        - metric.name == "http.server.request.duration"

      statements:

        - keep_keys(attributes, [
            "http.request.method",
            "http.response.status.code",
            "http.request.route"
          ])

        - replace_pattern(
            attributes["http.request.route"],
            "^/?([^/]+).*$",
            "$$1"
          )
The important idea isn’t the exact configuration.
It is the cardinality policy behind it.
We are effectively saying:
For this metric, only these dimensions have enough diagnostic value to justify becoming metric dimensions.
Removing High-Cardinality Kubernetes Resource Attributes
The same principle applies to resource attributes.
Kubernetes exposes useful metadata such as:
k8s.pod.name
k8s.pod.uid
container.id
process.pid
These can be extremely useful when examining individual telemetry records.
But that doesn’t mean they should automatically be dimensions on every metric.
For the metrics where these attributes weren’t providing meaningful analytical value, we removed them.
For example:
transform/reduce_resource_cardinality:
  error_mode: ignore

  metric_statements:
    - context: resource

      statements:

        - delete_key(attributes, "k8s.pod.uid")
        - delete_key(attributes, "k8s.pod.name")
        - delete_key(attributes, "process.pid")
        - delete_key(attributes, "container.id")
Again, this is not a recommendation to remove all Kubernetes metadata.
The correct approach depends on what you need to troubleshoot.
The principle is:
Don’t automatically turn every piece of resource metadata into a metric dimension.
The Cardinality Control Strategy
Our approach can be summarized as four steps.
1. Identify high-cardinality metrics
Find the metrics producing disproportionately large numbers of series.
In our case, the HTTP server metrics were the first major contributors.
2. Identify high-cardinality dimensions
Look at the attributes attached to those metrics.
Typical candidates include:
user_agent
request URL
session ID
customer ID
pod UID
container ID
process ID
3. Keep useful dimensions
Ask:
Does this dimension help an engineer answer an operational question?
For HTTP metrics, useful dimensions might include:
HTTP method
HTTP status
logical route
4. Normalize or remove expensive dimensions
Don’t automatically remove useful dimensions.
Instead:
Dynamic route → normalized route
Unnecessary attribute → removed
Useful attribute → retained
This preserves diagnostic value while putting a boundary around cardinality.
Why Cardinality Should Be Managed at the Telemetry Pipeline
One of the advantages of doing this in the OpenTelemetry Collector is centralization.
Imagine having 50 applications.
If every application team independently manages metric cardinality, you can end up with 50 different telemetry policies.
A collector provides a common control point:
Applications
     │
     ▼
OpenTelemetry
Instrumentation
     │
     ▼
OpenTelemetry Collector
     │
     ├── Cardinality controls
     ├── Attribute filtering
     ├── Route normalization
     └── Resource filtering
     │
     ▼
Observability Backend
This makes the telemetry pipeline an important part of your observability architecture.
Instead of discovering expensive dimensions only after they reach the backend, you can establish policies earlier in the pipeline.
How to Think About Metric Cardinality in Production
The biggest lesson from this investigation was that cardinality is not simply a storage problem.
It is an observability design problem.
The instinctive response to increasing telemetry volume is often:
Collect fewer metrics.
But that’s not always the right answer.
You may end up removing the metrics engineers actually need during an incident.
A better question is:
Which dimensions provide diagnostic value, and which dimensions create disproportionate cardinality?
For example:
| Dimension | Typical diagnostic value | Cardinality risk |
|---|---|---|
| HTTP method | High | Low |
| HTTP status | High | Low |
| Normalized route | High | Medium |
| Full dynamic URL | Medium | High |
| User agent | Low–Medium | High |
| Pod name | Medium | High/churn |
| Pod UID | Low for many metrics | High/churn |
| Process PID | Low for many metrics | High/churn |
| Container ID | Low for many metrics | High/churn |
The exact decision will depend on your environment.
There is no universal list of attributes that should always be removed.
The important thing is to make the decision deliberately.
How to Prevent OpenTelemetry Cardinality Problems
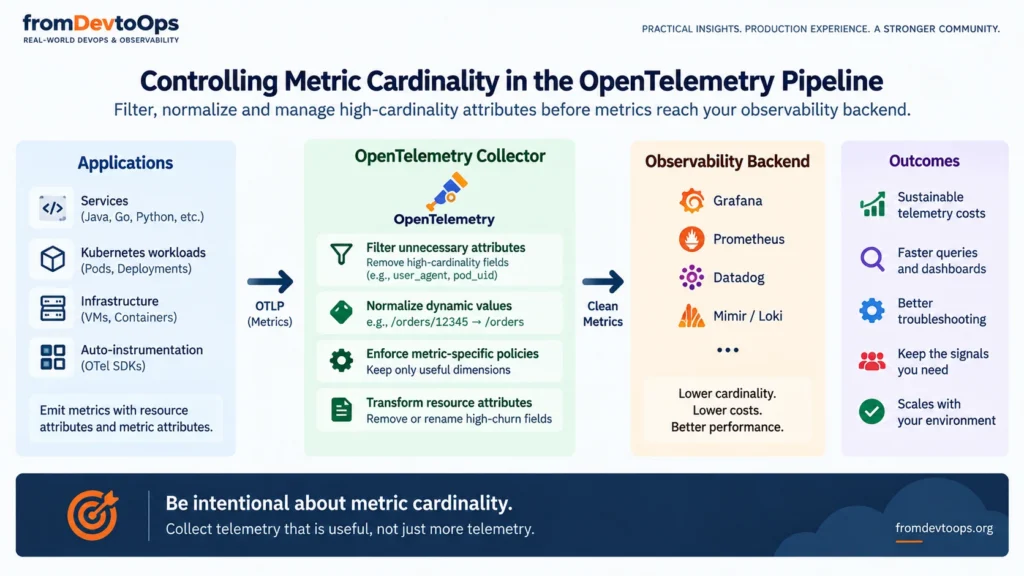
Cardinality is much easier to control when it is treated as part of telemetry design rather than something you fix after the observability bill increases.
Before adding a metric dimension, ask:
Does this attribute have bounded values?
For example:
HTTP method:
GET
POST
PUT
DELETE
This is naturally bounded.
Compare that with:
customer_id
request_id
session_id
These can have enormous numbers of unique values.
Will the value change frequently?
Highly dynamic values are more likely to create churn.
Does the attribute help answer an operational question?
If not, it may not belong on the metric.
Could the value be normalized?
Dynamic URLs are a good example.
Instead of:
/orders/12345
/orders/12346
/orders/12347
you may be able to represent the logical endpoint as:
orders
Should this information be a log or trace attribute instead?
Not every piece of contextual information needs to become a metric dimension.
This is an important observability design principle:
Metrics should remain relatively low-cardinality signals. Logs and traces can carry richer, high-cardinality context.
A Practical OpenTelemetry Cardinality Checklist
Before sending application metrics to your observability backend, review the following:
Metric names
- Are you collecting metrics you actually use?
- Are there duplicate or redundant metrics?
- Are application metrics clearly defined?
Metric attributes
- Which attributes have the highest number of unique values?
- Are request IDs being used as metric dimensions?
- Are customer IDs being used as metric dimensions?
- Are dynamically generated URLs being used as dimensions?
- Is
user_agentnecessary?
Kubernetes resource attributes
Review attributes such as:
k8s.pod.name
k8s.pod.uid
container.id
process.pid
Ask whether each one needs to participate in metric identity.
HTTP telemetry
Pay particular attention to:
http.request.route
http.request.method
http.response.status.code
user_agent
Routes should generally represent logical endpoints rather than every dynamically generated URL.
Collector controls
Consider using the OpenTelemetry Collector to:
- filter unnecessary attributes
- normalize dynamic values
- remove high-churn resource attributes
- establish metric-specific policies
The Result
After applying the cardinality controls, we saw a substantial reduction in active metric series and overall telemetry volume.
The biggest improvement came from the three high-cardinality HTTP metrics.
More importantly, we didn’t simply throw away the telemetry.
We retained the dimensions that were useful for answering questions such as:
Which endpoint is failing?
Which HTTP status codes are increasing?
Which request types are experiencing latency?
while removing dimensions that created large numbers of additional series without providing equivalent diagnostic value.
That distinction matters.
The objective isn’t:
Collect less telemetry.
The objective is:
Collect telemetry that remains useful.
Key Takeaways
1. Metric count is not metric cardinality
You can have a relatively small number of metrics and still generate millions of time series because of high-cardinality attributes.
2. Investigate dimensions before deleting metrics
If one metric is generating a large number of series, investigate its attributes before simply removing the metric.
3. Normalize dynamic values
Dynamic URLs are a common example. Preserve the logical endpoint while removing unnecessary uniqueness.
4. Don’t blindly remove Kubernetes metadata
Pod names, container IDs, and process IDs can be useful in some contexts. Remove them only where their diagnostic value doesn’t justify their cardinality.
5. Treat cardinality as an observability design problem
Cardinality should be considered when designing instrumentation, not only after telemetry costs or backend performance become a problem.
6. Use the OpenTelemetry Collector as a control point
The Collector provides a central place to enforce telemetry policies across multiple applications and workloads.
Final Thought
The most useful question we asked during this investigation wasn’t:
“Which metrics can we remove?”
It was:
“Which dimensions actually help us troubleshoot the system?”
That shift in thinking changed the solution.
Instead of reducing visibility, we reduced unnecessary uniqueness.
And that is ultimately what good observability engineering should do:
Preserve the signals engineers need while controlling the complexity those signals create.
Frequently Asked Questions
What is metric cardinality in OpenTelemetry?
Metric cardinality is the number of unique time series produced by a metric based on its metric attributes and resource attributes. A single metric can generate thousands or millions of time series when it contains high-cardinality dimensions.
Why is high metric cardinality a problem?
High cardinality can increase telemetry ingestion volume, observability costs, storage requirements, query complexity, and backend resource consumption. It can also make metrics systems harder to operate at scale.
How can I reduce OpenTelemetry metric cardinality?
Start by identifying which metrics and attributes produce the most unique series. Remove unnecessary high-cardinality attributes, normalize dynamic values such as URLs, and review Kubernetes resource attributes such as pod IDs and container IDs.
Should I remove user_agent from OpenTelemetry metrics?
Not necessarily. The decision depends on whether it provides useful operational information in your environment. If it creates a large number of unique values without providing proportional diagnostic value, removing it from metrics can significantly reduce cardinality.
Should pod names be included in metrics?
It depends on the use case. Pod identity can be useful for some operational investigations, but rapidly changing Kubernetes identities can create additional series. Consider whether the attribute is necessary for the particular metric.
Can the OpenTelemetry Collector reduce metric cardinality?
Yes. The OpenTelemetry Collector can be used to transform telemetry, filter attributes, normalize values, and remove unnecessary dimensions before metrics reach the observability backend.
Is high cardinality the same as high metric volume?
No. They are related but different. Metric volume describes the amount of telemetry being generated, while cardinality describes the number of unique time series. A small number of metrics can still create very high cardinality.